Nasdaq Composite falls 5.28% as Friday’s selloff deepens
The Nasdaq Composite fell 5.28%, the S&P 500 fell 3.7%, and the VIX closed at 35.89. Compare the three benchmarks and check the Thanksgiving trading hours.
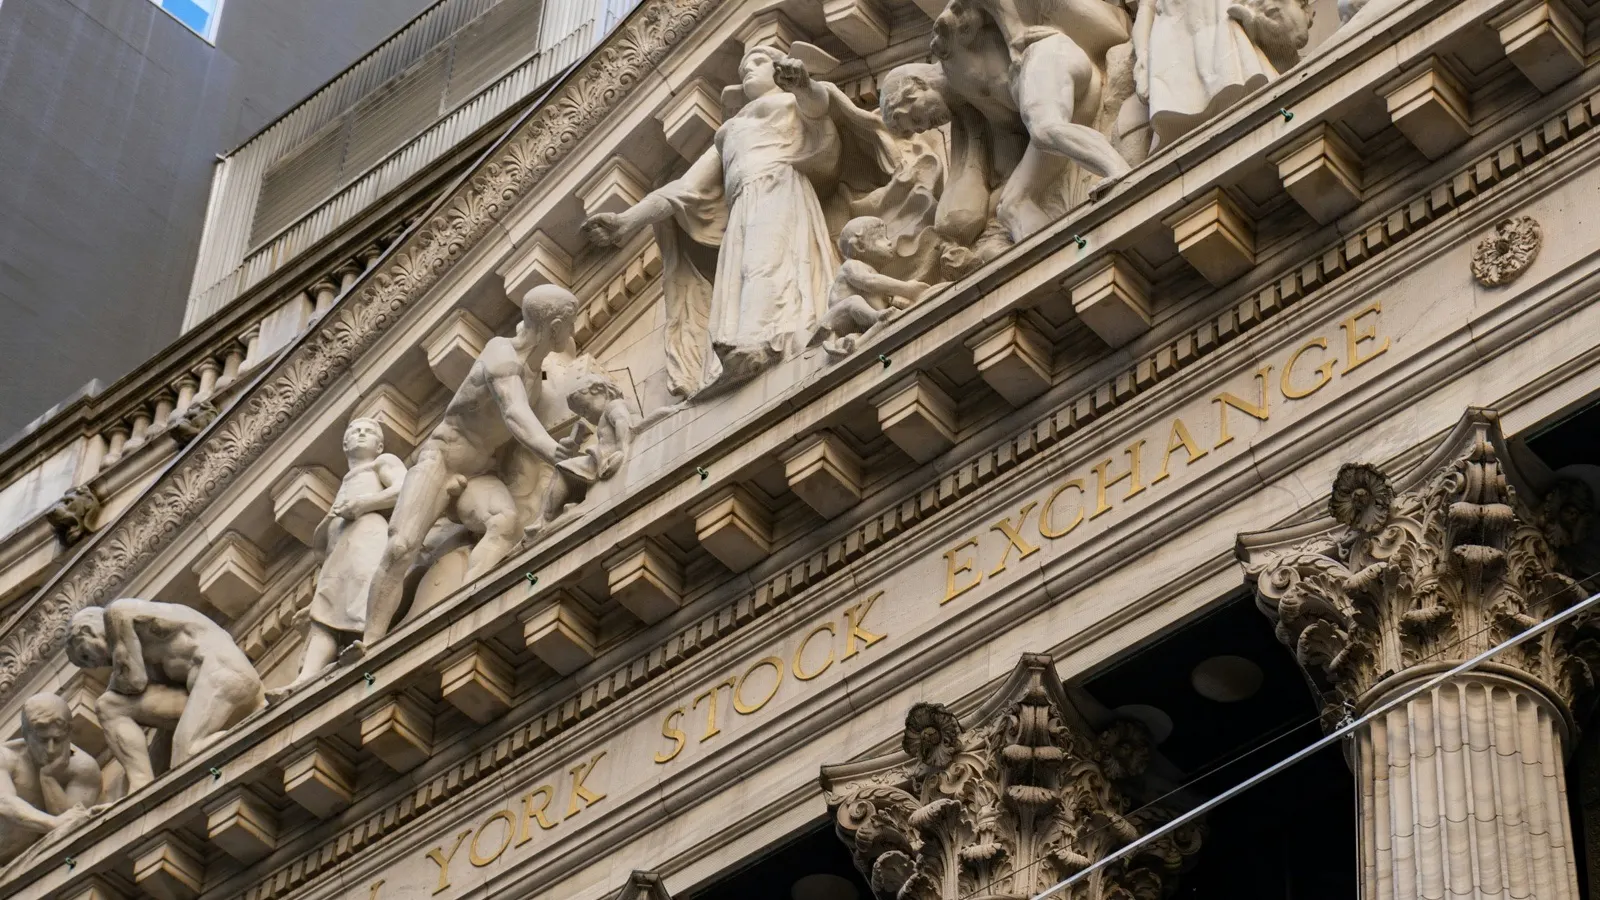
The Nasdaq Composite closed Friday at 22,617.73, down 5.28% on the day, as a week of heavy selling in technology shares ended with the index’s largest drop of the week. The S&P 500 fell 3.7% to 6,910.39, according to the Associated Press closing tally. The Cboe VIX history records a close of 35.89, up from 28.44 Thursday.
Those numbers answer three related questions. The Nasdaq Composite tracks stocks listed on the Nasdaq exchange, the S&P 500 tracks large U.S. companies across exchanges, and the VIX measures volatility implied by S&P 500 options. Stock prices and the price of protection against market swings can move differently, even in the same session.
Friday’s close in three figures
| Measure | Nov. 20 close | Change from Thursday |
|---|---|---|
| Nasdaq Composite | 22,617.73 | Down 5.28% |
| S&P 500 | 6,910.39 | Down 3.7% |
| Cboe VIX | 35.89 | Up 7.45 index points |
The difference between the two stock index losses was about 1.58 percentage points. That is 5.28 minus 3.70, using the published, rounded returns. The VIX move uses a different unit. Its rise of 7.45 is the difference between two index levels, 35.89 and 28.44. Relative to Thursday’s VIX close, the increase was about 26.2%.
These comparisons help show how strongly technology-heavy shares moved relative to a broader large-company index. They cannot explain why each investor sold or how much a given retirement account lost. The mix of holdings in an account determines how closely its returns track a benchmark.
The time window can change the picture just as much as the benchmark. AP’s close report shows the S&P 500 down 3.7% on Friday and 8.6% for the week. Its reference to a correction uses a third comparison, the index’s decline from its Oct. 6 high. A session return, a weekly return and a drawdown from a previous high each have a different starting point.
Why the Nasdaq Composite and QQQ give different readings
The Nasdaq Composite’s index description covers eligible common-type shares listed on Nasdaq. When a market headline says the Nasdaq fell a certain percentage, it often means this index. The Invesco QQQ fund tracks the Nasdaq-100, which selects 100 large nonfinancial companies listed on the exchange. A ticker quote for the fund is also a traded price for shares in that fund.
That distinction matters when comparing a headline with a brokerage balance. Two common benchmarks that include large technology names can react to the same earnings report yet move by different amounts. Their eligible securities and weighting systems differ. A broker’s end-of-day fund price is a third figure. Check the full name or ticker before comparing percentage changes across charts.
The immediate backdrop included the selloff in major AI-linked shares, AP reported. The sector had also just seen Anthropic begin Nasdaq trading. Newsmerica’s IPO coverage explains how the company’s offer price and the prices paid in public trading describe different parts of that event.
There is a similar distinction between a company result and a market move. Nvidia’s earnings release is the source for its reported quarter and guidance. Friday’s quote is the price investors were willing to pay at the end of the session. A closing recap can show selling concentrated among companies tied to AI, while the earnings release establishes the company’s underlying results.
What the VIX move says about the next trading session
Cboe describes the VIX as a gauge of near-term volatility expectations drawn from option prices. It reflects the size of the move the market is pricing over roughly 30 days. It does not specify whether Monday’s index level will rise or fall. A higher reading suggests that traders are pricing larger potential swings.
There was a different number for the intraday peak. Cboe recorded a VIX high of 40.03 on Friday. The closing value of 35.89 was 4.14 points below that high. That is why a report written during the session can use a figure above 40 while a closing summary uses a figure below 36. Put a time or a session label next to either figure.
The next regular U.S. equity session is Monday, Nov. 23. Later in the week, the NYSE holiday calendar shows a Thursday Thanksgiving closure and a 1 p.m. Eastern close on Friday, Nov. 27. That shorter session matters when lining up end-of-day figures. A comparison with around-the-clock assets such as Bitcoin needs its own price source and time cutoff.
Trust & transparency
How we handled this story
Verified Nasdaq’s closing quote and Cboe’s daily series. Attributed the S&P 500 close to AP and checked the exchange’s holiday schedule.

Grounded in this reporting
Ask Newsmerica
Ask about this article. Answers quote the closest published passages and link back to their sources.
This tool retrieves article passages; it does not add outside facts.Keep exploring
More from Newsmerica
Related coverage

Business & Economy
Black Friday 2026 dates for Walmart, Target, Best Buy and Home Depot

Business & Economy
30 states join FTC’s Dollar General lawsuit as Family Dollar deal awaits approval

Business & Economy